
CHAPTER 5 : ECG LEADS
Page 1 of 1

CHAPTER 5 : ECG LEADS
![]() by Admin Sat Mar 13 2010, 22:11
by Admin Sat Mar 13 2010, 22:11
The usual way of recording these voltages from the heart is
with the 12 standard ECG leads. The leads actually show the differences in
voltage (potential) between electrodes placed on the surface of the body. The
leads can be subdivided into two groups: the six extremity (limb) leads and the six chest (precordial) leads
The six extremity leads--I, II, III, aVr , aVl , and aVf
--record voltage differences by means of electrodes placed on the limbs. They
can be further divided into two subgroups: the bipolar extremity leads (I, II,
and III) and the unipolar extremity leads (aVr , aVl , and aVf ).
The six chest leads--V1 , V2 , V3 , V4 , V5 , and V6 --record
voltage differences by means of electrodes placed at various positions on the
chest wall.
Extremity (Limb) Leads
BIPOLAR LEADS (I, II, AND III)
In connecting a
patient to an electrocardiograph, first place metal electrodes on the arms and
legs. The right leg electrode functions solely as an electrical ground.
The extremity leads are recorded first. Lead I, for example,
records the difference in voltage between the left arm (LA) and right arm (RA)
electrodes:
LEAD I = LA - RA
Lead II records the difference between the left leg (LL) and
right arm (RA) electrodes:
Lead II = LL - RA
Lead III records the difference between the left leg (LL)
and left arm (LA) electrodes:
Lead III = LL - LA
FINALLY ,
Lead I + Lead III = Lead II
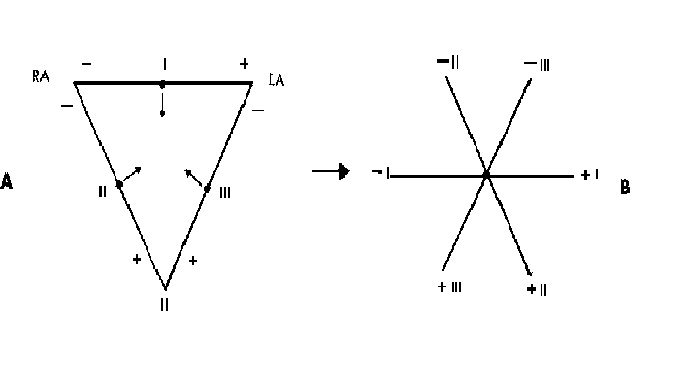
Leads I, II, and III can be represented schematically in
terms of a triangle, called Einthoven' s triangle.
It is a good practice to scan leads I, II, and III rapidly
when you first look at a mounted ECG. If the R wave in lead II does not seem to
be the sum of the R waves in leads I and II, this may be a clue that the leads
have been recorded incorrectly or mounted improperly. Thus in
electrocardiography, one plus three equals two.
Einthoven's triangle has been redrawn so that leads I, II,
and III intersect at a common central point. This was done simply by sliding
lead I downward, lead II rightward, and lead III leftward. The result is the
triaxial diagram.

TRIAXIAL DIAGRAM :
UNIPOLAR EXTREMITY LEADS (aVR , aVL , AND aVF ):
Six unipolar chest leads, V1 through V6 . Goldberger
invented the three augmented unipolar extremity leads: aVr , aVl , and aVf .
The abbreviation a refers to augmented; V to voltage; R, L, and F to right arm,
left arm, and left foot (leg) respectively.
Each of the unipolar leads can also be represented by a line
(axis) with a positive and negative pole.
As would be expected, the positive pole of lead aVr , the
right arm lead, points upward and to the patient's right arm. The positive pole
of lead aVl points upward and to the patient's left arm. The positive pole of
lead aVf points downward toward the patient's left foot.

Furthermore, just as leads I, II, and III are related by
Einthoven's equation, so leads aVr , aVl , and aVf are related:
aVr +aVl + aVf = 0
ie., the sum of the P wave voltages in the three leads is
zero, the sum of the QRS voltages is zero, and the sum of the T wave voltages
is zero.
It is also a good practice to scan leads aVr , aVl , and aVf
rapidly when you first look at a mounted ECG. If the sum of the waves in these
three leads does not equal zero, the leads may have been recorded incorrectly
or mounted improperly.
The ECG leads, both bipolar and unipolar, have two major
features. They have both a specific orientation and a specific polarity.
Thus the axis of lead I is oriented horizontally, and the
axis of lead aVr points diagonally downward. The orientation of the bipolar
leads is shown in Einthoven's triangle ,and the orientation of the unipolar extremity
leads
The second major feature of the ECG leads, their polarity,
can be represented by a line (axis) with a positive and a negative pole.
Do not be confused by the difference in meaning between ECG
electrodes and ECG leads. An electrode is simply the metal plate used to detect
the electrical currents of the heart in any location. An ECG lead shows the
differences in voltage detected by electrodes. For example, lead I presents the
differences in voltage detected by the left and right arm electrodes. Therefore
a lead is a means of recording the differences in cardiac voltages obtained by
different electrodes.
RELATIONSHIP BETWEEN UNIPOLAR AND BIPOLAR EXTREMITY LEADS
Einthoven's triangle above shows the relationship of the
three bipolar extremity leads (I, II, and III). Similarly, the triaxial diagram
shows the relationship of the three unipolar extremity leads (aVr , aVl , and
aVf ). For convenience, these two diagrams can be combined so that the axes of
all six extremity leads intersect at a common point. The result is the hexaxial
lead diagram shown below. The hexaxial diagram shows the spatial orientation of
the six extremity leads (I, II, III, aVr , aVl , and aVf ).

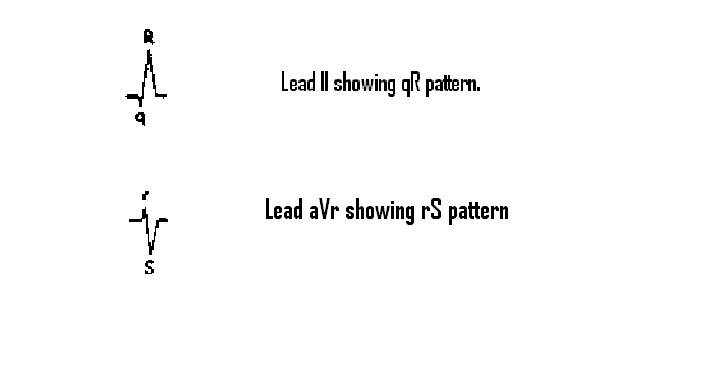
As you might expect by looking at the hexaxial diagram, the
pattern in lead aVl usually resembles that in lead I. The positive poles of
lead aVr and lead II, on the other hand, point in opposite directions.
Therefore the P-QRS-T pattern recorded by lead aVr is generally the reverse of
that recorded by lead II: For example, see the following ( also take any ECG
and VERIFY) . also see the nomenclature used !!!
Finally, the pattern shown by lead aVf usually but not
always resembles that shown by lead III.
with the 12 standard ECG leads. The leads actually show the differences in
voltage (potential) between electrodes placed on the surface of the body. The
leads can be subdivided into two groups: the six extremity (limb) leads and the six chest (precordial) leads
The six extremity leads--I, II, III, aVr , aVl , and aVf
--record voltage differences by means of electrodes placed on the limbs. They
can be further divided into two subgroups: the bipolar extremity leads (I, II,
and III) and the unipolar extremity leads (aVr , aVl , and aVf ).
The six chest leads--V1 , V2 , V3 , V4 , V5 , and V6 --record
voltage differences by means of electrodes placed at various positions on the
chest wall.
Extremity (Limb) Leads
BIPOLAR LEADS (I, II, AND III)
In connecting a
patient to an electrocardiograph, first place metal electrodes on the arms and
legs. The right leg electrode functions solely as an electrical ground.
The extremity leads are recorded first. Lead I, for example,
records the difference in voltage between the left arm (LA) and right arm (RA)
electrodes:
LEAD I = LA - RA
Lead II records the difference between the left leg (LL) and
right arm (RA) electrodes:
Lead II = LL - RA
Lead III records the difference between the left leg (LL)
and left arm (LA) electrodes:
Lead III = LL - LA
FINALLY ,
Lead I + Lead III = Lead II
Leads I, II, and III can be represented schematically in
terms of a triangle, called Einthoven' s triangle.
It is a good practice to scan leads I, II, and III rapidly
when you first look at a mounted ECG. If the R wave in lead II does not seem to
be the sum of the R waves in leads I and II, this may be a clue that the leads
have been recorded incorrectly or mounted improperly. Thus in
electrocardiography, one plus three equals two.
Einthoven's triangle has been redrawn so that leads I, II,
and III intersect at a common central point. This was done simply by sliding
lead I downward, lead II rightward, and lead III leftward. The result is the
triaxial diagram.
TRIAXIAL DIAGRAM :
UNIPOLAR EXTREMITY LEADS (aVR , aVL , AND aVF ):
Six unipolar chest leads, V1 through V6 . Goldberger
invented the three augmented unipolar extremity leads: aVr , aVl , and aVf .
The abbreviation a refers to augmented; V to voltage; R, L, and F to right arm,
left arm, and left foot (leg) respectively.
Each of the unipolar leads can also be represented by a line
(axis) with a positive and negative pole.
As would be expected, the positive pole of lead aVr , the
right arm lead, points upward and to the patient's right arm. The positive pole
of lead aVl points upward and to the patient's left arm. The positive pole of
lead aVf points downward toward the patient's left foot.
Furthermore, just as leads I, II, and III are related by
Einthoven's equation, so leads aVr , aVl , and aVf are related:
aVr +aVl + aVf = 0
ie., the sum of the P wave voltages in the three leads is
zero, the sum of the QRS voltages is zero, and the sum of the T wave voltages
is zero.
It is also a good practice to scan leads aVr , aVl , and aVf
rapidly when you first look at a mounted ECG. If the sum of the waves in these
three leads does not equal zero, the leads may have been recorded incorrectly
or mounted improperly.
The ECG leads, both bipolar and unipolar, have two major
features. They have both a specific orientation and a specific polarity.
Thus the axis of lead I is oriented horizontally, and the
axis of lead aVr points diagonally downward. The orientation of the bipolar
leads is shown in Einthoven's triangle ,and the orientation of the unipolar extremity
leads
The second major feature of the ECG leads, their polarity,
can be represented by a line (axis) with a positive and a negative pole.
Do not be confused by the difference in meaning between ECG
electrodes and ECG leads. An electrode is simply the metal plate used to detect
the electrical currents of the heart in any location. An ECG lead shows the
differences in voltage detected by electrodes. For example, lead I presents the
differences in voltage detected by the left and right arm electrodes. Therefore
a lead is a means of recording the differences in cardiac voltages obtained by
different electrodes.
RELATIONSHIP BETWEEN UNIPOLAR AND BIPOLAR EXTREMITY LEADS
Einthoven's triangle above shows the relationship of the
three bipolar extremity leads (I, II, and III). Similarly, the triaxial diagram
shows the relationship of the three unipolar extremity leads (aVr , aVl , and
aVf ). For convenience, these two diagrams can be combined so that the axes of
all six extremity leads intersect at a common point. The result is the hexaxial
lead diagram shown below. The hexaxial diagram shows the spatial orientation of
the six extremity leads (I, II, III, aVr , aVl , and aVf ).
As you might expect by looking at the hexaxial diagram, the
pattern in lead aVl usually resembles that in lead I. The positive poles of
lead aVr and lead II, on the other hand, point in opposite directions.
Therefore the P-QRS-T pattern recorded by lead aVr is generally the reverse of
that recorded by lead II: For example, see the following ( also take any ECG
and VERIFY) . also see the nomenclature used !!!
Finally, the pattern shown by lead aVf usually but not
always resembles that shown by lead III.

Admin- Admin
- Posts : 76
Reputation : 8
Join date : 2010-01-06
Age : 34
Location : chennai
» CHAPTER 6 : ECG LEADS AND MONITER LEADS
» CHAPTER 2 : Basic waves
» CHAPTER 3 : Basic waves part 2
» CHAPTER 4 : BASIC WAVES , HEART RATE
» CHAPTER 7 : NORMAL WAVES "P"
» CHAPTER 2 : Basic waves
» CHAPTER 3 : Basic waves part 2
» CHAPTER 4 : BASIC WAVES , HEART RATE
» CHAPTER 7 : NORMAL WAVES "P"
Page 1 of 1
Permissions in this forum:
You cannot reply to topics in this forum